AQI Prediction Dashboard
A linear-regression AQI forecasting project paired with a Power BI decision-support dashboard for global city-level air quality analysis.
Overview
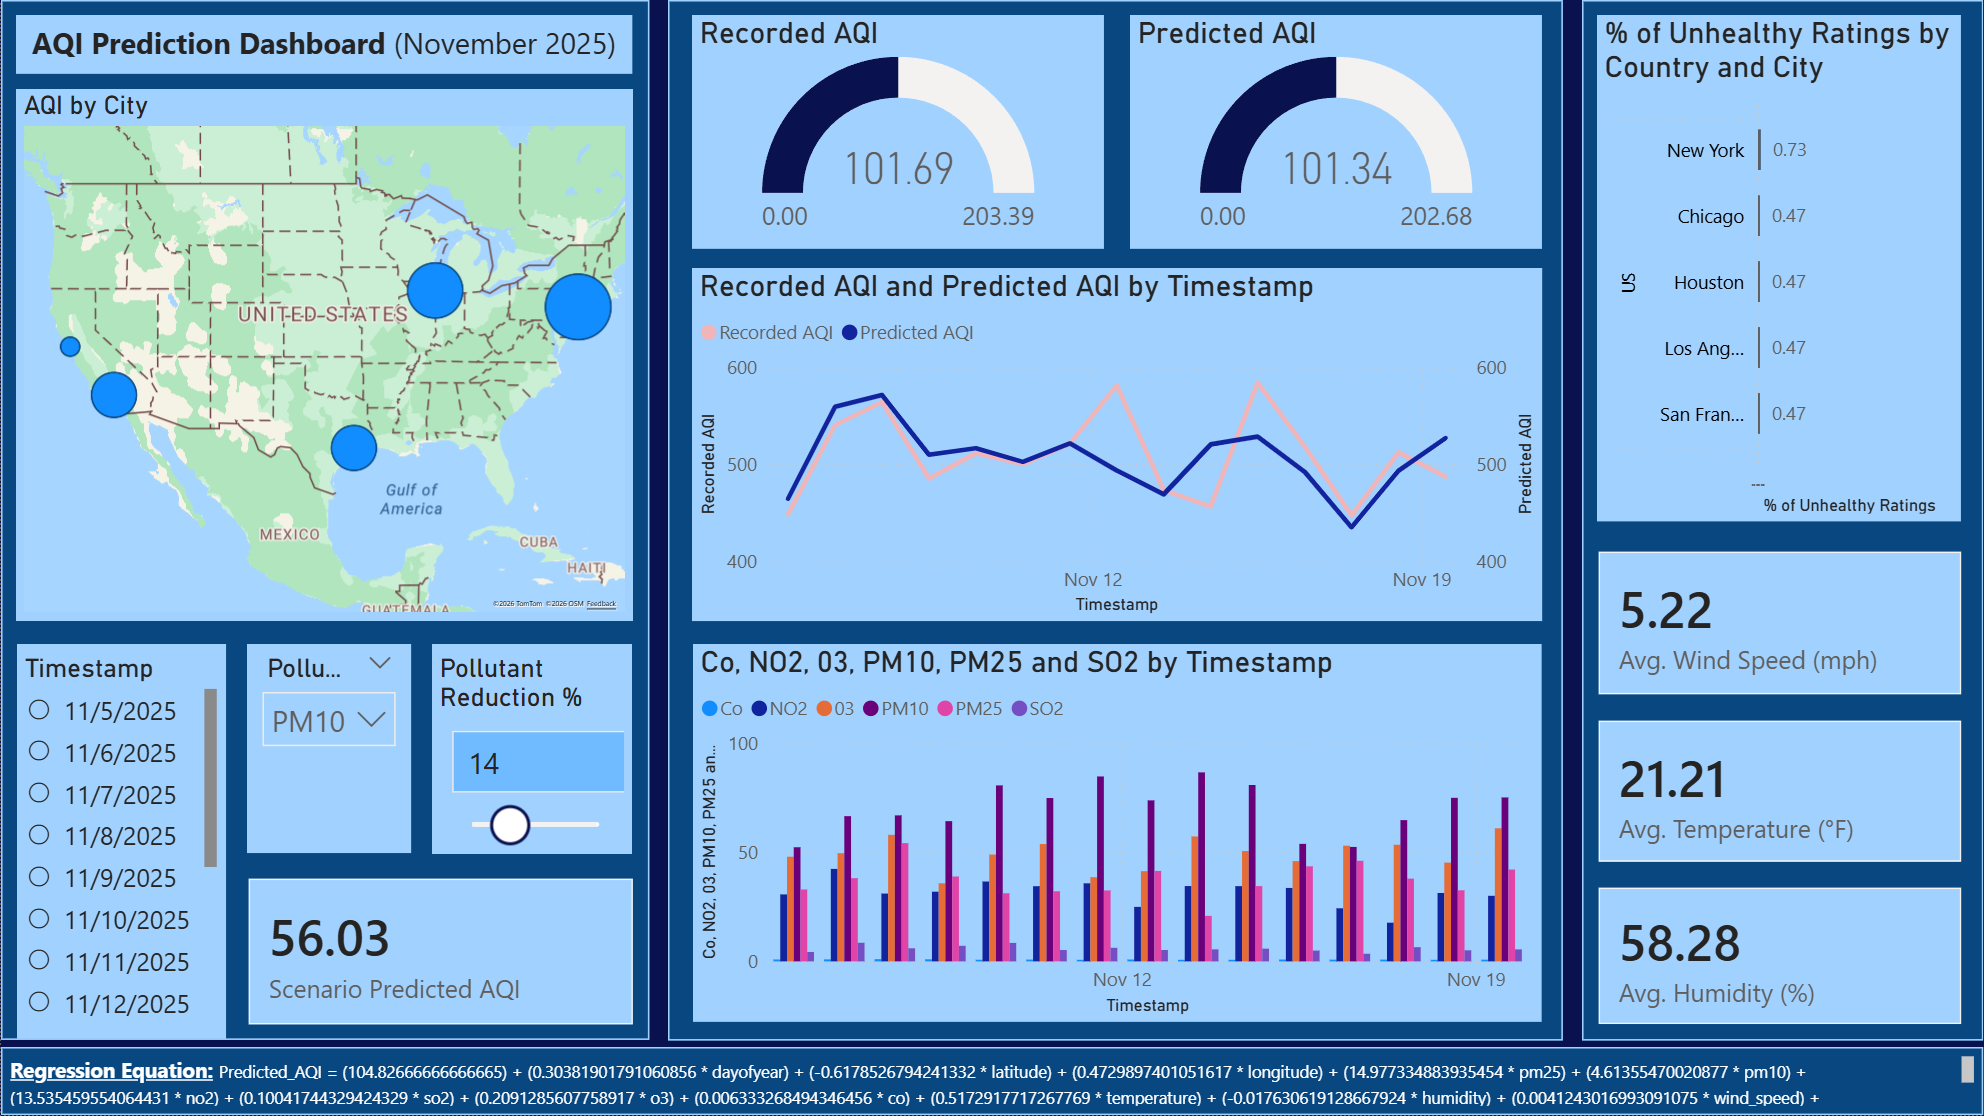
An end-to-end analytics project combining Python-based AQI prediction with a Power BI dashboard for exploratory analysis and policy-oriented decision making. The workflow covered data cleaning, constrained sampling, linear-regression forecasting, and interactive reporting so users can compare city and country risk patterns, pollutant relationships, and forecast outcomes.
My Role
Solo data analyst and dashboard developer. I owned the full pipeline: raw data ingestion and cleaning in Python, feature selection and model training with scikit-learn, and dashboard design and publishing in Power BI. I made deliberate tradeoffs to keep the forecasting model interpretable for non-technical viewers while still delivering meaningful predictive signal.
Project Snapshot
Project Type
End-to-end data analytics + interactive dashboard
Core Goal
Turn a large, noisy global air-quality dataset into an interpretable decision-support tool
Technical Stack
Python, Pandas, scikit-learn, Power BI, SQL
Data Challenge
Sampled ~900k rows down to 750 records (one per city per day) while preserving representativeness
Key Contributions
- 01
Built a full data-to-dashboard pipeline from preprocessing and feature preparation through model output visualization
- 02
Identified PM2.5, PM10, and NO2 as the strongest AQI-associated pollutant indicators in the sample
- 03
Used hierarchical drilldowns to surface city-level hotspots hidden by country-level averages
- 04
Implemented what-if analysis patterns to estimate AQI response under pollutant reduction scenarios
- 05
Designed dashboard layout to support both executive-level KPI scanning and city-level drilldown analysis
Interactive Demo
AQI Prediction Dashboard
Interactive Power BI dashboard for exploring global AQI patterns, city-level hotspots, pollutant relationships, and what-if forecasting scenarios.
Outcome
The final deliverable is an interactive Power BI dashboard that surfaces global AQI trends, city-level risk hotspots, and pollutant contribution breakdowns in a format accessible to both technical and non-technical audiences. The linear regression model achieved reasonable forecast accuracy on the sampled dataset and the what-if scenario tool gives users a concrete way to explore how pollutant reductions could shift AQI outcomes.
Next Project
MusicMatrix